Homework 6: API's - What's the Weather Like?
For this assignment we were given the task of attempting to prove and find evidence supporting the claim “It really does get hotter the closer you get to the equator.” To accomplish this, we were instructed to randomly select cities from around the world and request data from an API available to us about the current temperature for each of our chosen cities. Armed with this information, we then can create ourselves some scatterplots and run analysis on the data in order to see if there is any standing to the claim.
The first part of the task, randomly choosing the cities, turned out to be one of the more difficult steps for me. The starter code provided did it for most of my classmates without any thought required whatsoever however I was not satisfied with how the starter code runs for a number of reasons. I took it upon myself to heavily rewrite the code used to generate our list of cities.
Originally, the starter code would attempt to select an $(x,y)$ point from a rectangular grid uniformly at random. Interpreting the grid as a map of the world these $(x,y)$ points would be treated as longitude and latitude respectively. This, I feel, is a mistake as it would be just as likely to pick a point from a small grid square close to the pole as it is to pick a point from a small grid square near the equator since the squares are the same area when viewed as a part of the rectangular map. On the globe however, the area described by the grid square near the pole is much smaller than that of the grid square near the equator, giving an unfair bias away from the equator and towards the poles.
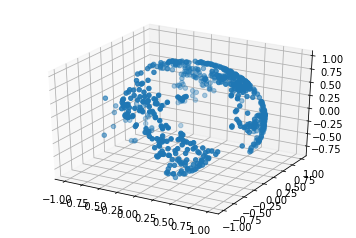
To remedy this, I opted to select points on the globe uniformly at random through the use of some multivariate distributions. Letting $X,Y,Z$ each be independently normally distributed random variables, $\mathcal{N}(0,1)$, and treating the globe as the unit sphere (yes, the globe is technically a spheroid, not a sphere, this is a simplification), we have that $(X,Y,Z)$ is equally likely to be pointing in any direction. Normalizing the vector $(X,Y,Z)$ by dividing by the vector’s norm gives us a uniformly randomly selected point from the sphere without any bias towards the poles. I then converted these $(x,y,z)$ points back to latitude,longitude coordinates for ease of use for the rest of the code.
The starter code would then take our randomly selected points and utilize a recommended package, Citipy, to determine what the closest city to our point is. Again, I feel this is an oversimplification that provides unfair bias to certain regions. The surface of the earth is mostly water, oceans taking up a considerable portion of the area. Every time a point we selected was from the ocean, Citipy would tell us the closest city would either be an island city or a coastal city.
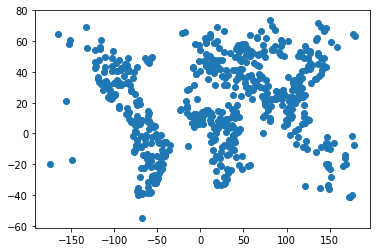
To remedy this, I opted to ask “how far away is the ‘nearest city’ to my originally selected point?” This required looking up where the city that Citipy directed me towards is actually located and finding the distance between those points (which is easiest done using $(x,y,z)$ coordinates rather than latitude-longitude coordinates requiring more conversions). If the distance was too far (currently set at 2% the radius of the earth in my code) then that would imply the point was too far in the middle of the ocean or in the middle of a desert or tundra to be of use and I would scrap that point to try to get another to fill its place.
The resulting city locations are pictured below:
Click on the links above on the navigation bar to see what we were able to learn.